Beszel Server Monitoring: Why VAON Moved Off Grafana
Summary: Beszel is an open-source server monitoring tool made of a hub and a lightweight agent on each machine. VAON moved its internal server monitoring from Grafana to Beszel because our Grafana dashboards had plenty of metrics but few daily viewers. Beszel puts every server on one screen, with Docker stats, alerts and S.M.A.R.T. built in. It does not show logs.

What was wrong with our Grafana setup?
Grafana itself was fine. The problem was how the VAON team used it on an earlier product. Grafana collects almost anything and lets you build as many dashboards as you want, so the number of screens grew with every project.
Over time we hit three problems:
- Every project had its own dashboard, with the same metric under slightly different names and units.
- Each engineer configured data collection differently, so adding a server meant remembering the steps again.
- Dashboards were packed with panels, yet in the morning people only wanted two answers: is the server up, and is there enough disk?
The third one hurt most. Having many metrics is not the issue. We never separated the screen everyone checks daily from the screen you dig into during an incident. The result: the dashboard was opened only after something had already broken.
What is Beszel and how does it work?
Beszel is a lightweight, MIT-licensed monitoring platform with two parts:
| Component | Role |
|---|---|
| Hub | Web app built on PocketBase; shows dashboards and stores history |
| Agent | Runs on each monitored server and sends metrics to the hub |
The hub stores its own data, so you do not need a separate time-series database such as Prometheus or InfluxDB. According to Beszel's official security guide, the hub and agent connect in one of two directions:
| Connection | Initiated by | Default port |
|---|---|---|
| SSH | Hub → agent | 45876 |
| WebSocket | Agent → hub | 8090 |
The SSH connection accepts only the hub's public key and provides no terminal or input, so even a leaked key cannot run commands on the agent. For servers inside a private network that the hub cannot reach, the outbound WebSocket direction is usually easier to get through a firewall.
How do you deploy Beszel for internal servers?
Beszel needs only Docker Compose on the hub and on each server. The process VAON follows:
- Start the hub with a
docker-compose.ymlusing thehenrygd/beszelimage, port 8090 and a data volume. - Add a server with the "Add System" button in the hub UI. The hub generates an agent compose file with the public key (
KEY), token (TOKEN) and hub address (HUB_URL). - Run the agent on the server with that compose file. Mount
/var/run/docker.sockread-only to get per-container CPU, memory and network. - Set alerts per server in the form "which metric, above what threshold, for how long".
- Register a notification channel in Settings > Notifications using a Shoutrrr URL (Slack, Discord, Telegram, Teams and more).
Since version 0.12.0, a universal token lets agents connect without registering the server on the hub first. Adding a server is now "drop in the compose file and start it". A small thing, but nobody has to remember the steps anymore.
What does the team see on the dashboard every day?
The Beszel overview lists each server on one row: CPU, memory, disk, GPU, load average, network and uptime. Cells with high usage turn yellow, so the row that needs attention stands out without reading every number. Project names in our screenshots are masked.
In the screenshot above, "Active Alerts" shows a development server whose disk usage stayed above 80% for more than 10 minutes. That is a real alert rule running in our environment, not sample data.

Each server's detail page shows per-container Docker charts out of the box. In Grafana, that view usually needs an extra collector such as cAdvisor.

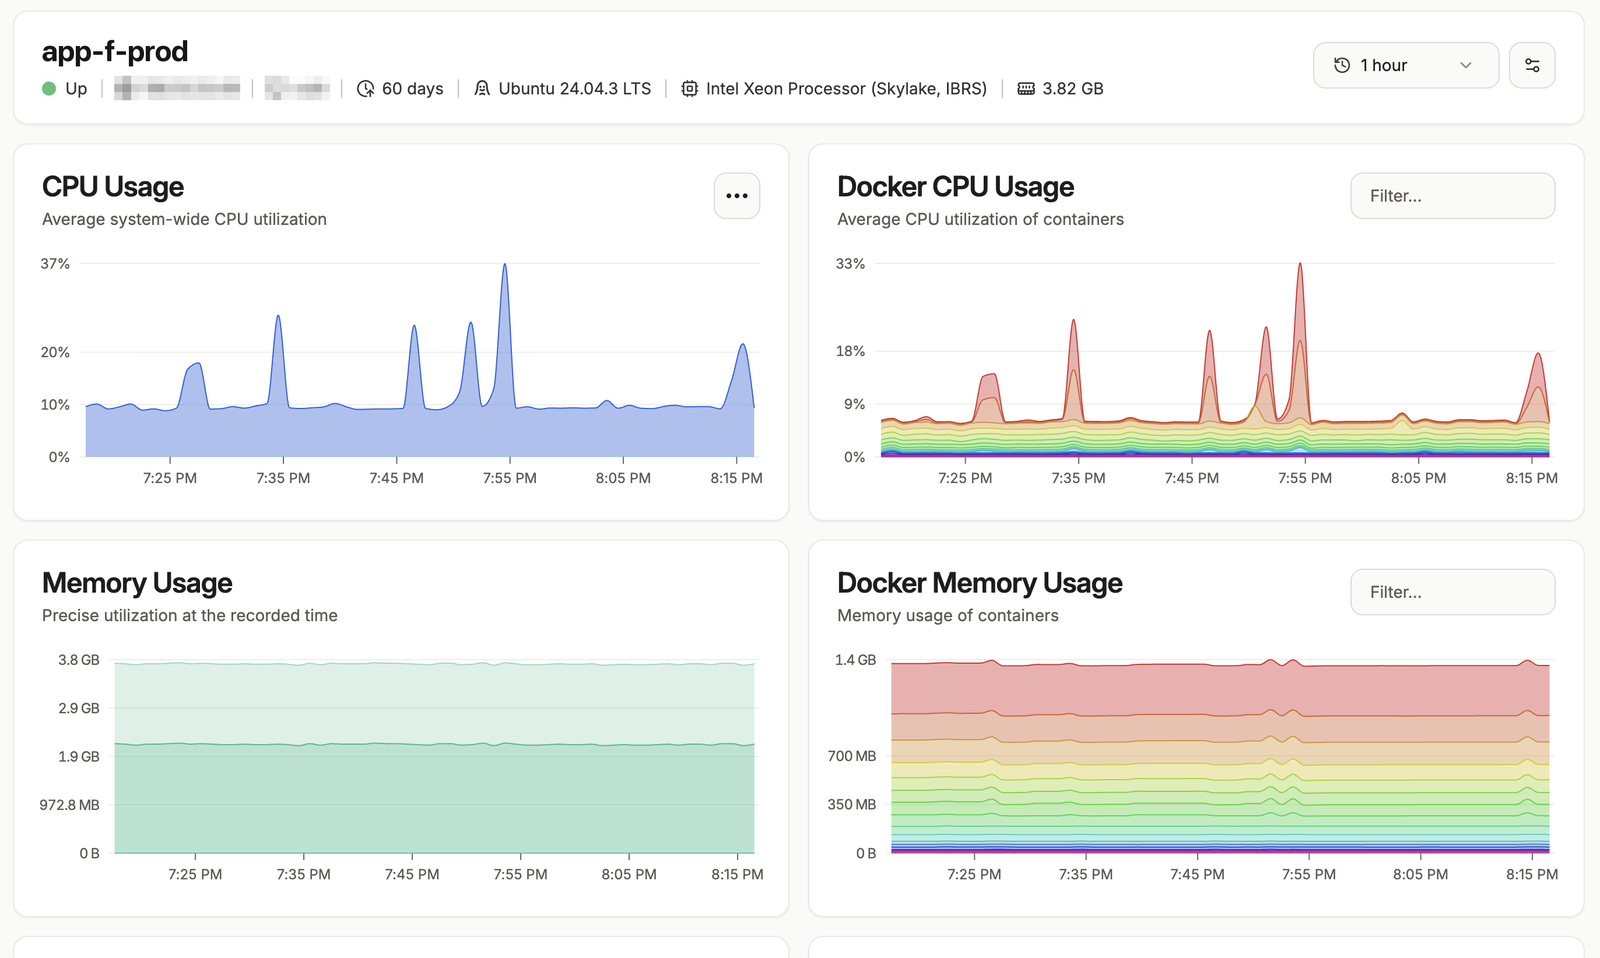
On this server, CPU, bandwidth and Docker network spikes line up at almost the same times. The filter on the Docker charts narrows down which container caused them. Beszel will not always find the root cause, but it tells you where to look next.
What do you need for S.M.A.R.T. disk monitoring?
S.M.A.R.T. (Self-Monitoring, Analysis and Reporting Technology) is a drive's self-diagnostic data, used to catch disks that are about to fail. It is one reason VAON chose Beszel for internal servers. When a cloud server's disk fails, the provider handles it. When an on-premise disk fails, your team has to notice and replace it.
Note that cloud VPS instances use virtual disks and expose no S.M.A.R.T. data. The feature only matters for servers with physical drives.
Per Beszel's official S.M.A.R.T. guide, you need to:
- Install
smartmontoolson the agent machine (smartctl7.0 or later). - For Docker, switch the agent image to
henrygd/beszel-agent:alpine. - Pass the disk devices into the container (for example
/dev/sda,/dev/nvme0) and grantSYS_RAWIOfor SATA andSYS_ADMINfor NVMe. - For a systemd agent, add
AmbientCapabilities,CapabilityBoundingSetandDeviceAllowunder[Service].
Pass whole devices (sda, nvme0), not partitions (sda1). S.M.A.R.T. alerts have no adjustable threshold: Beszel notifies you automatically when it detects a failure, as long as at least one notification channel is set up.
How is Beszel different from Grafana?
Beszel and Grafana solve different problems. The table sums up the main differences for server-level monitoring:
| Criteria | Beszel | Grafana (with Prometheus) |
|---|---|---|
| Components to run | Hub + agent | Grafana + Prometheus + exporters |
| Adding a server | Copy compose file from hub, start it | Install exporter, edit scrape config |
| Per-container Docker metrics | Built in | Needs cAdvisor or similar |
| Dashboard customization | Fixed | Nearly unlimited |
| Free-form queries | None | PromQL |
| Logs, application metrics | No | Yes (Loki, app exporters) |
| S.M.A.R.T. | Built in, automatic alerts | Needs a separate exporter |
In short, Beszel answers "are my servers healthy?". Grafana can answer almost any question, if you have time to configure it.
When should you not use Beszel?
Beszel is the wrong fit when you need to see inside your application:
- It does not show logs.
- It does not collect application metrics such as request count, latency or queue length, and you cannot add custom metrics.
- Dashboards are fixed, with no free-form queries like PromQL.
- S.M.A.R.T. alert conditions cannot be tuned.
For products that need detailed application observability, Prometheus and Grafana remain the better choice. VAON uses Beszel for the server layer and leaves application monitoring to other tools.
What changed after the switch?
Before switching, we worried that fewer metrics would make incidents harder to trace. So far, everything we need to know at the server level is on the Beszel screens.
The biggest change was how many people open the dashboard. With a single overview, people outside the infrastructure team check it in the morning and flag any yellow bar to the owner. If we started over, the first decision would not be which metrics to collect. It would be who opens the screen each morning, and who they tell when something turns yellow.
If you are planning how to monitor a system after launch, see VAON's system development services and DX consulting, or book a free consultation to review your current operations setup.