In interface design, not all elements are equally important. A good interface does not just help users see information; it also helps them know where to look first.
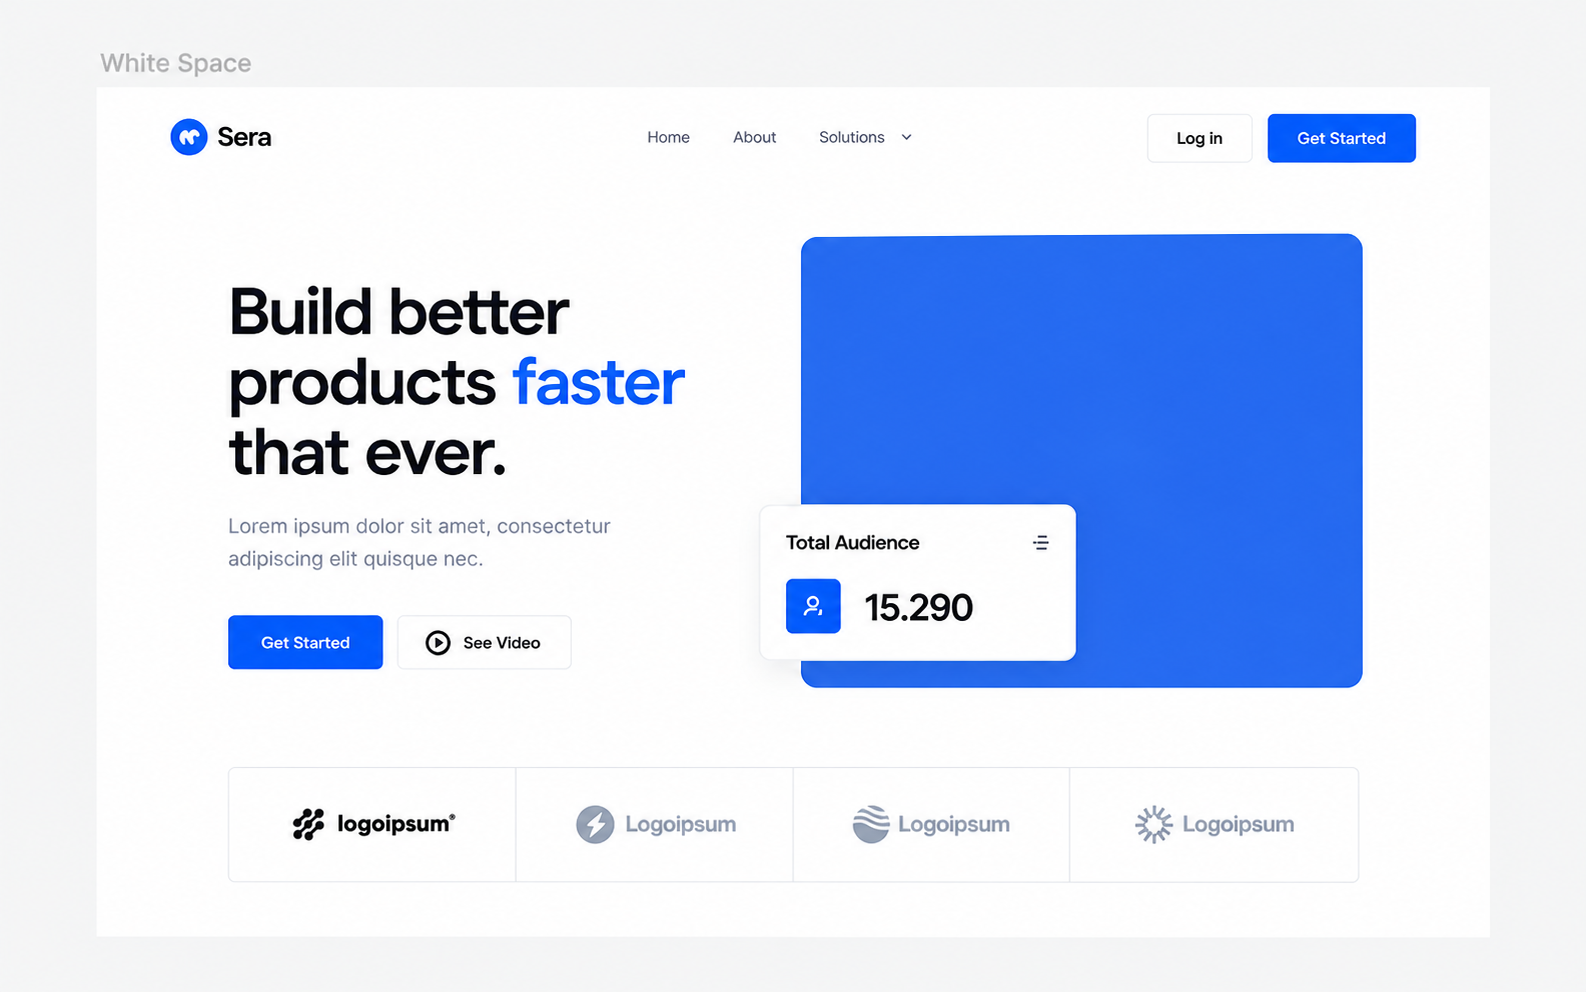
Have you ever visited a website and instantly known what you needed to do, even before reading all the content on the page? Conversely, there are interfaces filled with complete information, harmonious colors, and well-crafted components, yet you still do not know where to start. The difference sometimes lies not in the amount of information displayed, but in how it is organized and emphasized.
In UI Design, we call this Visual Hierarchy.
This is one of the key principles that helps designers guide user attention, clarify priorities among elements, and make interfaces easier to understand. However, Visual Hierarchy is not simply about making a heading very large or coloring a button brightly. To use it effectively, we need to understand how visual elements work together.
What is Visual Hierarchy?
According to Gordon (2021), visual hierarchy is the arrangement of elements in a way that implies importance, guiding the user's attention in the order desired by the designer. Simply put, visual hierarchy helps answer three questions:
- What will the user notice first?
- What information should they process next?
- Ultimately, what action needs to be taken?
Imagine a product page consisting of a title, description, illustration, and sign-up button. If all elements have the same size, color, and emphasis, the user will have to figure out for themselves what information is most important. But if the title is highlighted, the description has a lower priority, and the action button is clearly distinguished, the interface becomes much easier to navigate.
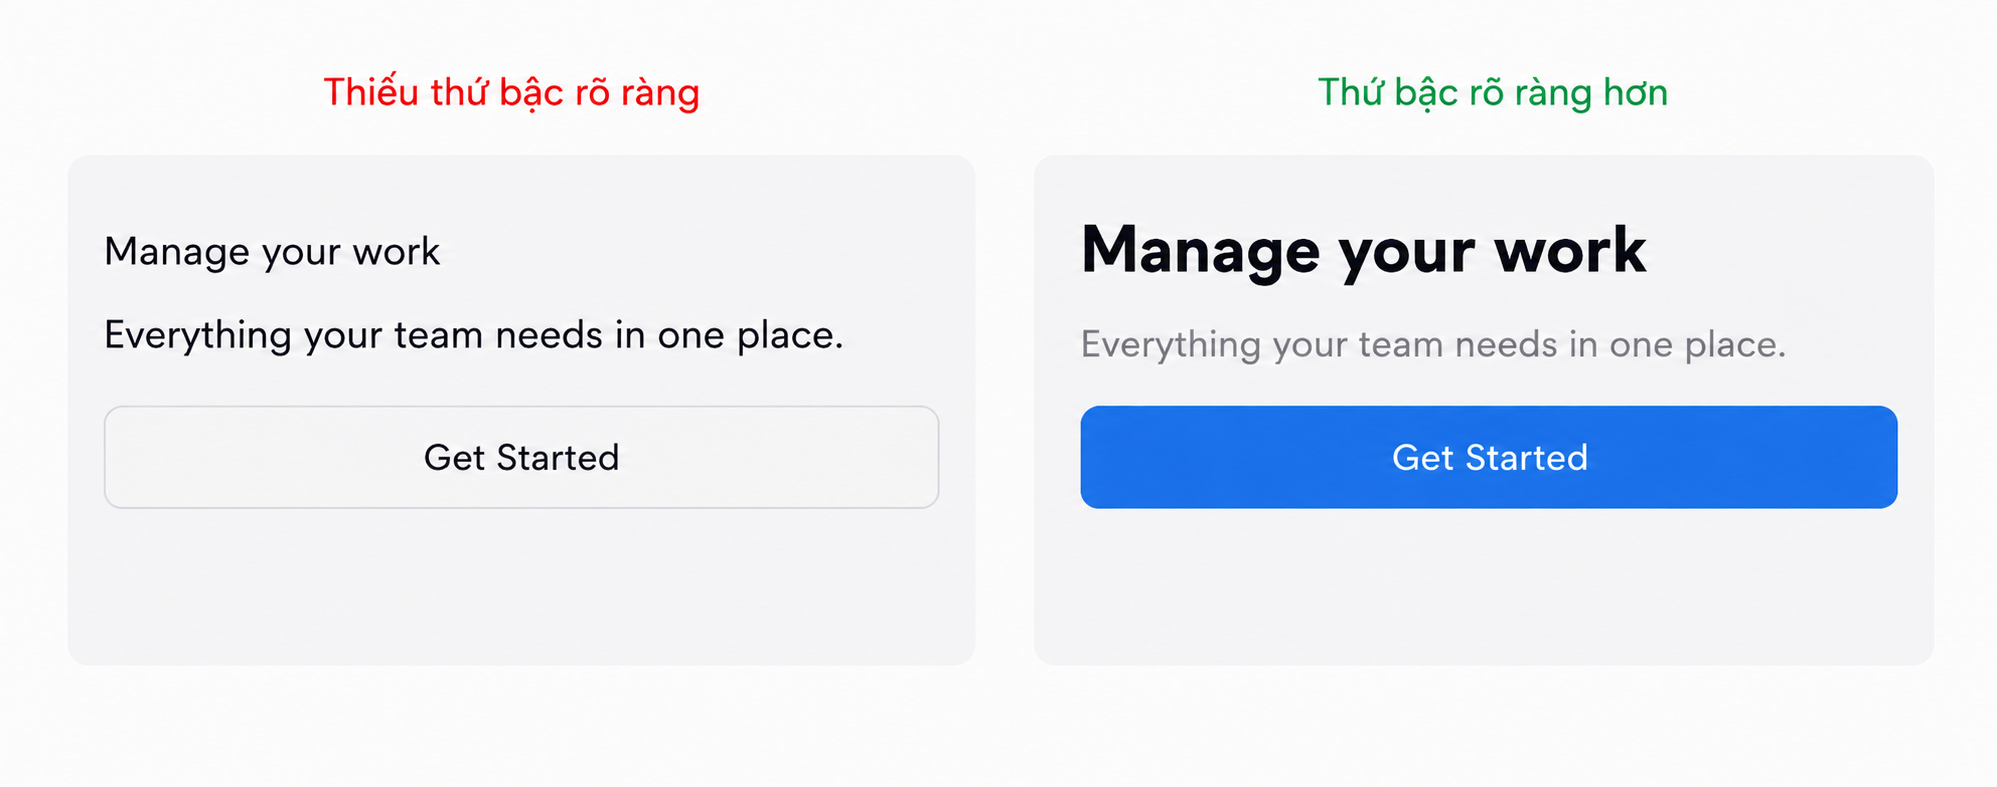
In the example on the right, users can easily differentiate the main heading, supporting content, and the required action. This is the role of Visual Hierarchy: not only presenting information, but also conveying the importance of each piece of information.
Size & Scale: Size Creates Priority
One of the easiest ways to create visual hierarchy is by using differences in size. Larger elements generally attract attention more easily than smaller ones, all else being equal. This is why headings are usually larger than body descriptions, key metrics on a dashboard stand out more than info labels, or main product images take up more space than secondary ones. According to Gordon (2020), scale is one of the five vital principles of visual design in UX. Changing the relative size of elements can help communicate priorities within an interface. However, large size only has meaning when there is a difference. If every element is large, nothing truly stands out. For instance, when designing a dashboard, we can build a typography hierarchy like this:
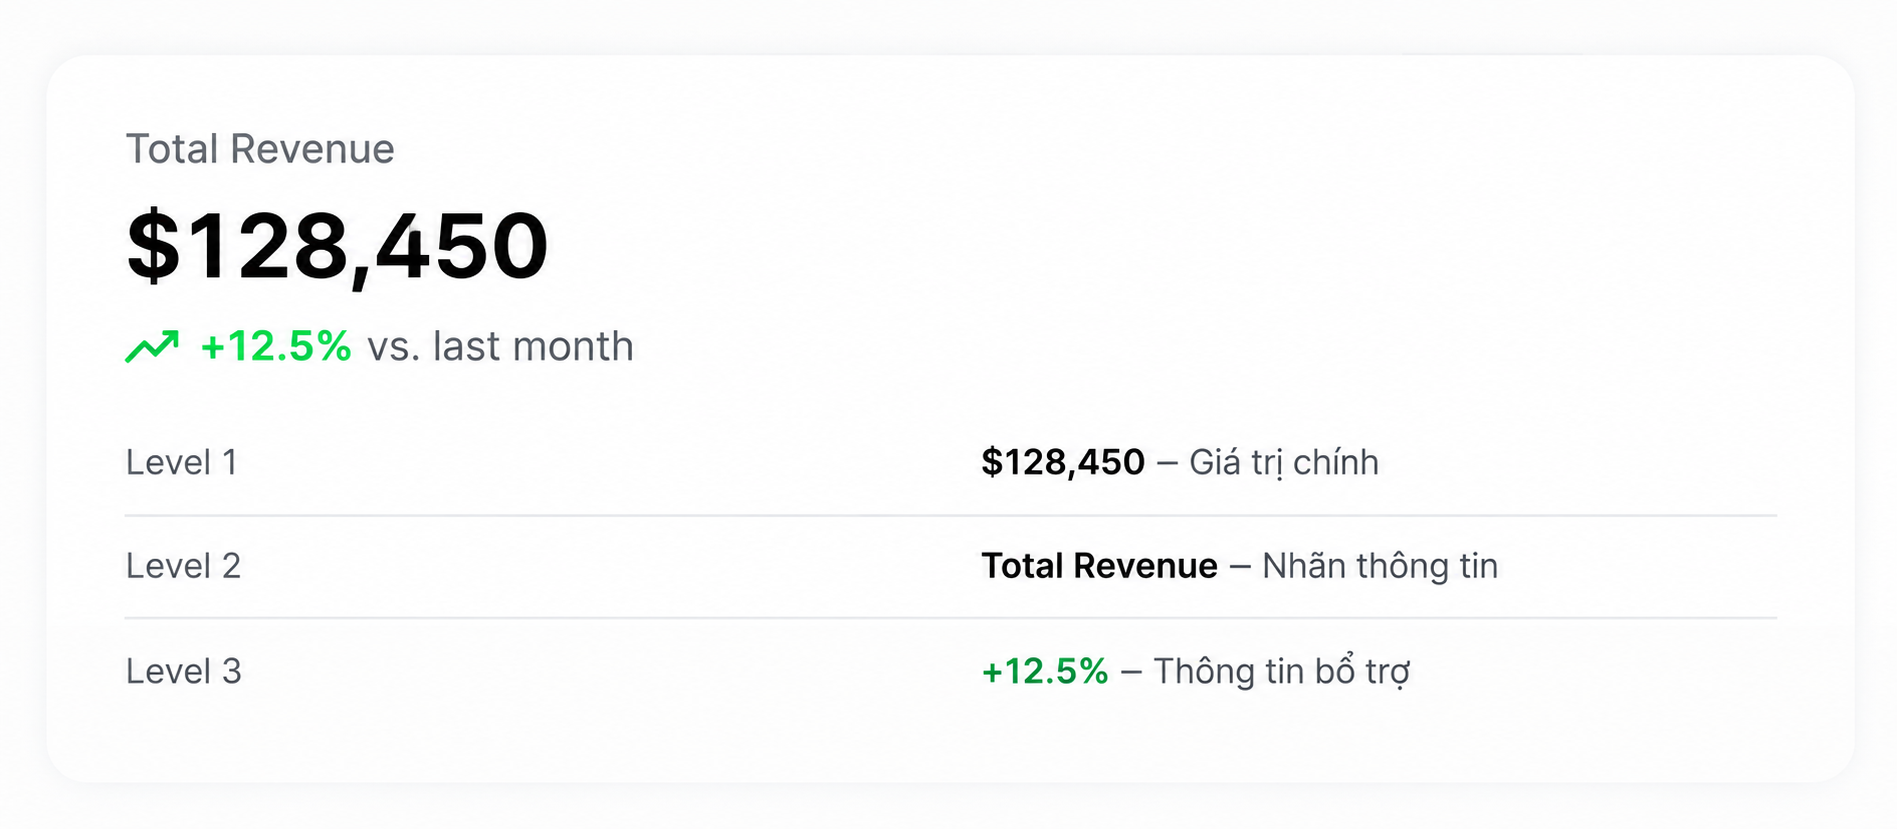
Here, the revenue value is prioritized because it is the primary information the user needs to track. Other contents serve as contextual support. The key is not how many font sizes are used, but rather that each level has a clear role in the information structure.
Color & Contrast: Not Every Bright Color is Important
Color and contrast are powerful tools for directing attention. A button with high contrast against the background is generally easier to recognize than one that blends into its surroundings. But there is a caveat: Visual Hierarchy does not depend on using overwhelmingly vibrant colors. According to Gordon (2021), differences in brightness, saturation, and contrast with surrounding elements are what truly determine an object's prominence. This means a black button on a white background can easily stand out more than a blue button on a background filled with competing visual elements.
Let's look at the example:
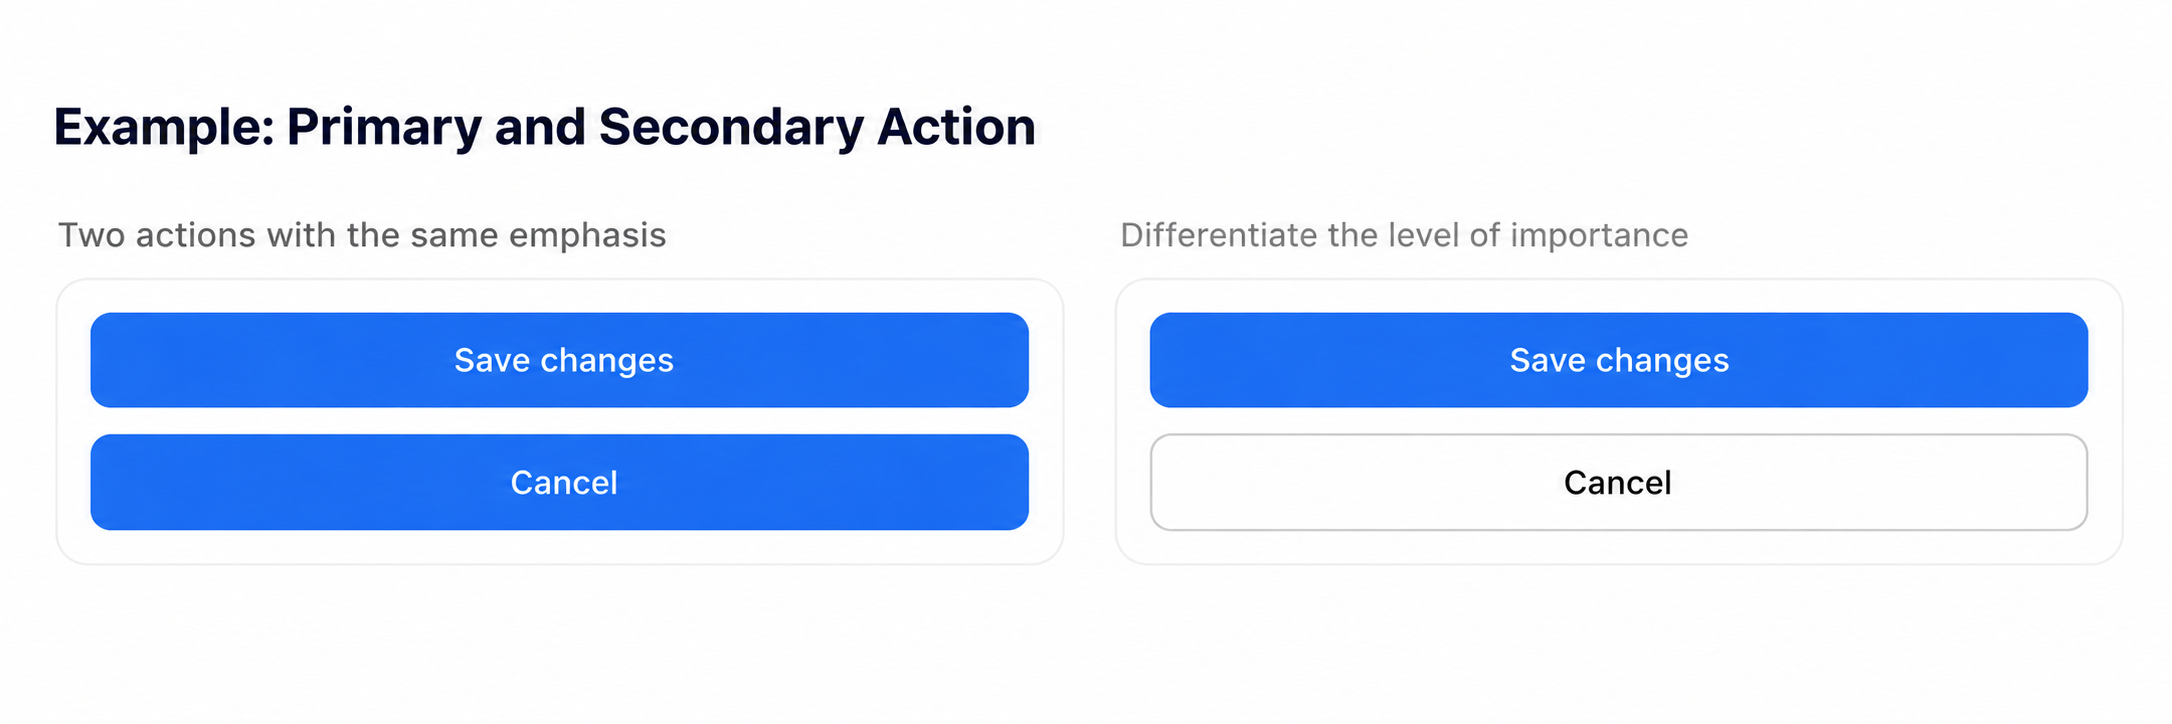
In the example on the right, the "Save Changes" action is emphasized, while "Cancel" remains present but does not compete for the same level of attention. This principle is extremely useful when designing forms, modals, pricing pages, or screens with multiple choices. However, designers should not rely solely on color to convey status or crucial meaning. Additional cues like text labels, icons, and interaction states will make the interface clearer, especially for users with color vision deficiencies.
Spacing & Grouping: Distance Can Also Guide the Gaze
In a previous article on spacing, I mentioned the role of distance in organizing information. Visual Hierarchy is a clear example of that principle. According to the Gestalt Principle of Proximity, elements placed close to each other are perceived as related. In interface design, this means we can create groups of information simply by adjusting spacing, without necessarily adding too many lines or borders. Gordon (2021) also points out that using proximity and common regions helps users recognize the interface's structure and identify related information clusters.
For example, in a product card, the product name and price are usually placed closer together than the distance between this card and another card. Similarly, on a landing page, the spacing between a heading and a description should show they belong to the same content group, while the distance between two sections needs to be distinct enough for users to recognize the transition. What I usually care about when adjusting spacing is not just whether the overall layout is balanced, but rather: What elements is this distance connecting, and what information groups is it separating? If we can answer that question, spacing becomes a tool to organize the experience rather than serving a purely decorative purpose.
Position & Alignment: Placement Affects How Information is Received
The position of an element in a layout also affects its likelihood of being noticed. In many left-to-right reading interfaces, elements placed at the top or near the beginning of the content have a higher chance of being seen early. However, this is not a fixed rule for every user or product. The order of observation also depends on the user's goals, language, layout, screen size, and high-prominence elements. Therefore, instead of blindly applying a reading model, I typically focus on ensuring that important information appears in easily recognizable locations within the actual context of use.
For instance, on an e-commerce page, details like the product image, name, price, and purchase action need to be organized into an easily scannable structure. Meanwhile, lower-priority details like detailed return policies or technical specs can be placed in supplementary areas, as long as users can still easily find them when needed. Alignment also helps elements create a consistent visual order. An interface with properly aligned content blocks is generally easier to scan than one with too many unaligned starting points.
Visual Weight: When Everything Stands Out, Nothing Truly Does
Another crucial concept is Visual Weight. Visual Weight describes the degree to which an element attracts attention based on factors like size, color, contrast, and position. A large image, a bold heading, or a high-contrast button can all possess high visual weight. But problems arise when we try to emphasize too many elements at once.
Imagine a landing page with a very large title, multiple bolded text lines, three brightly colored buttons, a promotional banner, and several emphasized icons. Every element tries to grab attention, resulting in a cluttered overall design lacking a focal point. In an article on the signal-to-noise ratio, the Nielsen Norman Group (2018) recommends emphasizing only truly important information to avoid overwhelming the interface with competing elements.
To me, this is a memorable principle: To make an element stand out, sometimes we do not need to make it stronger—we just need to reduce the emphasis on surrounding elements. For example, instead of increasing the size of a primary button, we can decrease the contrast of the secondary button. Instead of making a title even larger, we can reduce the size and weight of supporting paragraphs. Visual Hierarchy is created not only by emphasizing, but also by proactively reducing attention given to less important elements.
How to Test an Interface's Visual Hierarchy?
After completing a design, I often want to check whether users actually notice the elements I prioritized. A quick testing method is the Squint Test. According to Wang (2023), the squint test involves narrowing your eyes while observing an interface to spot high-prominence elements and quickly evaluate the visual hierarchy. When squinting or viewing the interface at a reduced size, fine details become hard to distinguish, while blocks with high visual weight still stand out.
Aside from the squint test, I also regularly self-evaluate using these questions:
- In the first three seconds, which element is most likely to attract attention?
- Is that element truly the most important information?
- Can users distinguish between the primary action and secondary action?
- Do the information groups have clear relationships?
- Are there any elements standing out that do not provide much value?
While useful, the squint test is only a quick visual evaluation step. To determine the actual order of observation and effectiveness, we still need to test the design with target users whenever possible.
Visual Hierarchy Does Not Mean Total Control of the Gaze
An important point I want to emphasize is that designers can guide attention, but they cannot absolutely dictate where users will look. Users do not always read an interface in the exact order we intend. A visitor to a product page might care about the price before reading the product name. Another might want to check reviews or technical specifications. Similarly, on a dashboard, a manager might prioritize revenue, while an operations staff member focuses on alerts and system status.
Therefore, visual hierarchy should not merely reflect what the designer feels is important. It needs to be built around the real goals, needs, and contexts of the users. An interface with a good visual hierarchy does not necessarily force everyone to look in the exact same order. Instead, it makes necessary information easy to recognize, find, and use.
Good Design Means Knowing What Takes Priority
Visual Hierarchy is not simply a technique to make interfaces look prettier. It is the way we organize attention, communicate the importance of information, and support users in completing tasks. Size, color, contrast, spacing, position, and typography can all become tools to build visual hierarchy. But the most important thing is not how many techniques are used, but understanding the goal behind every decision.
Before making a heading larger, ask yourself why it needs priority. Before coloring a button brightly, determine if it is truly the most important action. And before adding a new element, consider whether it genuinely helps users understand the interface better.
To me, an interface with good visual hierarchy is not one where every element screams for attention. It is one that knows how to highlight what matters and let less important things recede at the right moment. Because ultimately, we are not just designing what users see—we are designing how they perceive and understand information.
References (APA 7th Edition)
- Gordon, K. (2020, March 1). 5 principles of visual design in UX. Nielsen Norman Group. https://www.nngroup.com/articles/principles-visual-design/
- Gordon, K. (2021, January 17). Visual hierarchy in UX: Definition. Nielsen Norman Group. https://www.nngroup.com/articles/visual-hierarchy-ux-definition/
- Nielsen Norman Group. (2018). Signal-to-noise ratio. https://www.nngroup.com/articles/signal-noise-ratio/
- Wang, H.-H. (2023, December 11). Squint test [Video]. Nielsen Norman Group. https://www.nngroup.com/videos/squint-test/